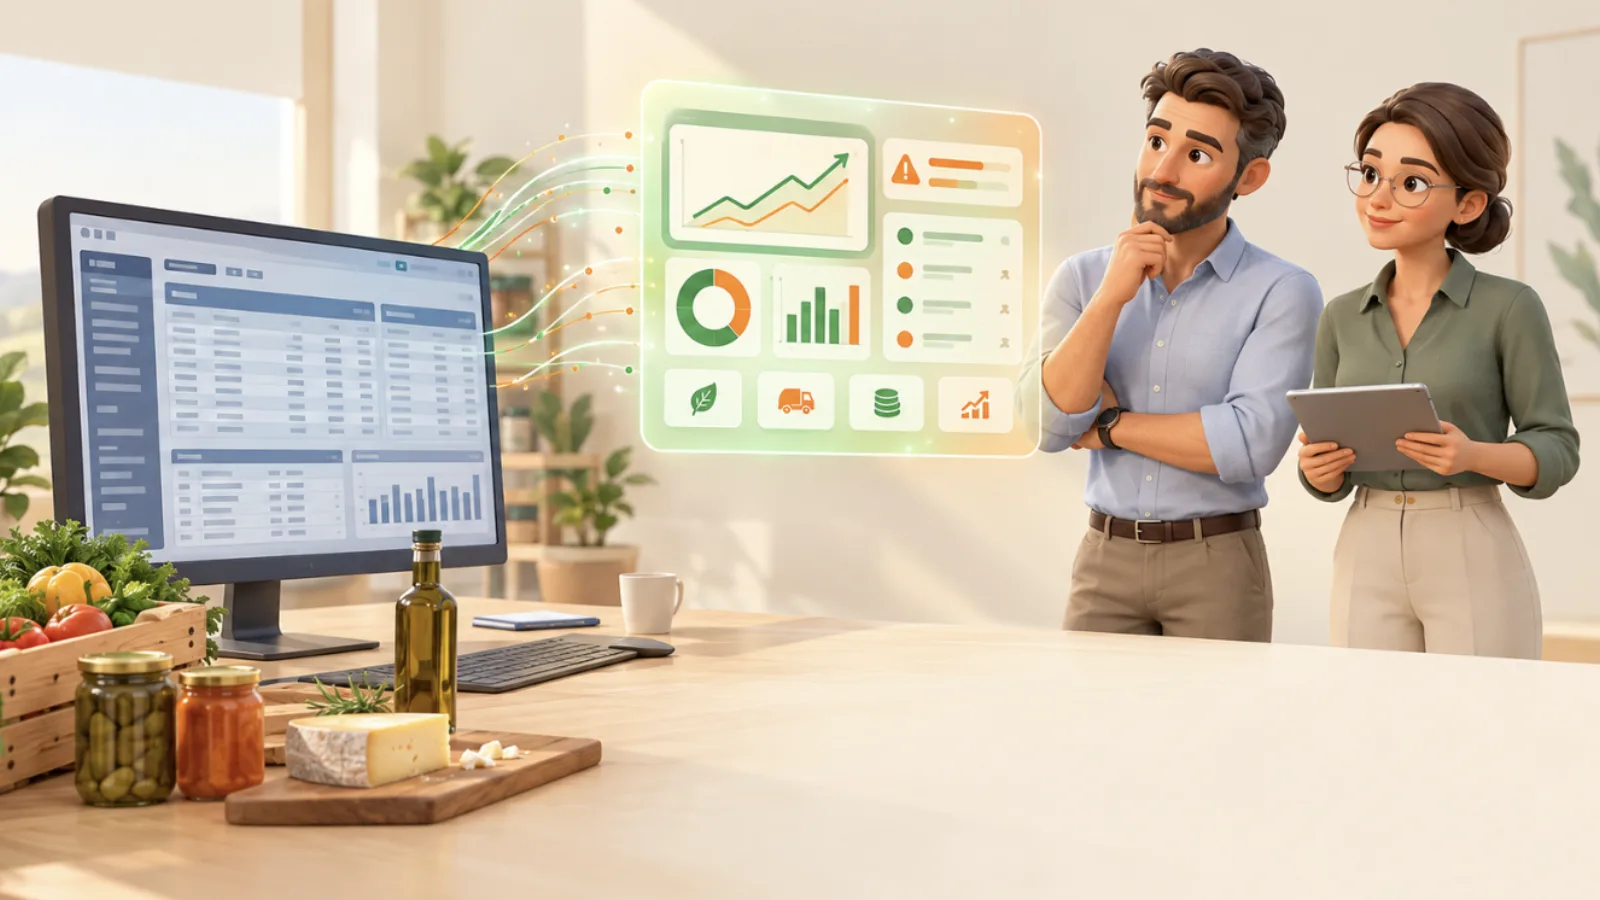
The data paradox in the food industry
Your ERP has been accumulating data for years. Your sales reps bring back field information every week. Your spreadsheets track purchasing, sales and production costs. You have, in reality, a considerable volume of information about your business.
And yet most important decisions are still taken on instinct.
This paradox is not specific to your company. According to a Talend and Qlik study published in 2022, 99% of companies acknowledge that data is essential to their success. At the same time, 97% of them report difficulties using it effectively. The French corporate data maturity observatory notes that only 19% of French SMEs and mid-caps considered themselves able to exploit their data properly in 2022.
In a sector where 98% of the 19,037 companies are SMEs, where margins are under structural pressure, and where responsiveness has become a competitive advantage, this situation has a real cost. Data-based management is no longer an ambition reserved for large groups. It is an operational necessity.
What "data-driven" really means for a food industry SME
The term is often associated with complex projects — data lakes, data scientists, sophisticated dashboards. For a food industry SME, the reality is simpler and more accessible.
A data-driven organisation is one whose strategic and operational decisions rest on objective data rather than on experience, instinct or subjective opinion. It is not the absence of human judgement — it is that judgement being exercised on verified facts rather than impressions.
Concretely, for a food industry SME leader, moving to data-driven management means being able to answer these questions in minutes, not days:
- Which customers ordered less this month, and on which references?
- What is the real margin of each product in my range, once current variable costs are included?
- If the price of a given raw material rises 8%, which products fall below my profitability threshold?
- Which customers are profitable, and which consume resources without contributing to margin?
These questions do not require hiring an analyst or changing ERP. They require the data that already exists in your organisation to be organised so as to answer them automatically.
Why it is still hard in most food industry SMEs
Data fragmented across several tools
The ERP stores orders and purchasing. The CRM or the sales spreadsheets track customers and selling prices. Production reports its data in a different tool, sometimes in Excel. Accounting works in its own software. These sources do not naturally talk to each other — and cross-referencing them takes time, manual exports and reconciliation work that consumes hours every week to produce figures that are often already out of date.
Too global a view of performance
Most SMEs run their business on aggregate indicators: total monthly revenue, overall gross margin, cumulative raw material purchases. These figures give a useful snapshot, but they mask individual situations — the products losing money, the structurally unprofitable customers, the references whose cost price has drifted without anyone noticing.
Response times that are too long
In a sector where raw material costs can vary significantly from one month to the next, where customer volumes fluctuate, and where commercial negotiations demand precise arguments, deciding on the basis of 30-day-old figures is a real constraint. Useful data is data available at the right moment.
The four steps to becoming a data-driven food industry SME
Step 1 — Accessibility: centralising your data sources
The first step is to gather the data that already exists into a single accessible place. ERP, sales tracking spreadsheets, purchasing data, production history — the point is not to create new data, but to connect the data you have.
This is the most technical step, but also the most decisive. As long as your data remains fragmented, everything else is impossible.
Key takeaway
You do not need perfect data to start. Imperfect data accessible in one place is infinitely better than perfect data scattered across five different tools.
Step 2 — Analysis: structuring and reading the data
Once centralised, data must be structured to be readable. This is where your key indicators are defined — and where the discipline of keeping only those that actually trigger decisions comes in.
For a food industry SME, a useful dashboard generally covers five to seven indicators:
| Indicator | Recommended frequency |
|---|---|
| Change in orders by customer | Weekly |
| Contribution margin by reference | Monthly (updated as soon as raw materials rise) |
| Purchase cost of key raw materials | Real time |
| Material loss rate by line | Monthly |
| Gap between theoretical and actual selling price | Monthly |
The rule is simple: if an indicator does not make you take a different decision from the one you would have taken without it, it does not belong on your dashboard.
Step 3 — Interpretation: understanding what the data says
This is the most often neglected step. Having structured data is not enough — it still has to be read with the right context.
Take an example. Sophie runs a dairy processing SME with nine million euros in revenue and notes a 4% drop in orders over the quarter. Read globally, that figure is worrying. Analysed by customer, it reveals that the drop is entirely concentrated on two accounts — both of which have reduced their orders on the same references. Read alongside purchasing data, it appears that those two customers have cheaper alternatives on that specific segment.
The decision is not the same depending on whether you have the first figure or all three. That is interpretation: not reading a metric in isolation, but in the context of what explains it.
In practice, this is the step that benefits most from automation. When a tool detects for itself that a drop in orders is concentrated on certain customers or certain references, and relates that information to other variables, it does in seconds what would take several hours by hand.
Step 4 — Action: deciding and acting faster
Data is only valuable if it leads to a decision. And a decision is only valuable if it is taken early enough to change something.
That is where data-driven management creates a tangible competitive advantage. A leader who knows in real time that the margin on a product line has fallen below its profitability threshold because of a raw material increase can act immediately — start a commercial renegotiation, adjust a production volume, trigger a price revision clause — rather than discovering the problem six weeks later at the monthly review.
What it changes in day-to-day decisions
Passing on a raw material increase. When the cost of a key ingredient rises, the question is not "do we pass it on?" but "on which products, for which customers, by how much, and by when?". That decision, taken on the basis of precise data, lets you defend your margins without needlessly risking important commercial relationships.
Defending the right customers. Not all customers deserve the same commercial effort. Data-based management makes it possible to quickly identify those whose orders are falling but who remain strategically profitable — and to concentrate sales energy where it generates the most value.
Understanding a quarterly margin drop. Rather than waiting for the accounting close to discover that the margin has fallen 2 points, real-time management makes it possible to identify the problem as soon as it appears — and to solve it before it deepens.
Where to start concretely
Define five non-negotiable indicators. Not twenty. Not ten. Five indicators you commit to tracking every week, whatever is happening in your business. They will form the foundation of your management.
Map your existing data sources. Before considering a new tool, identify what you have: where the sales data is, where the purchasing data is, where the production data is. In the vast majority of food industry SMEs, the necessary data already exists — it is simply not connected.
Choose a coherent reading horizon. In a sector with variable costs, weekly reading is more useful than monthly for operational indicators. Monthly reading remains relevant for trend indicators. Defining that horizon up front avoids spending time on data that will trigger no decision.
The three mistakes to avoid
| Mistake | Why it is a problem |
|---|---|
| Changing ERP before dealing with existing data | The data is in your current ERP. A new tool does not solve the problem if the management method does not change. |
| Waiting until you hire a data analyst | Current tools automate most of the analysis with no dedicated technical skill. |
| Trying to measure everything at once | A dashboard with 30 indicators is no more useful than one with 5 — it is often used less. |
Going further
Data-driven management is the condition for the other two major challenges facing food industry SMEs — managing margins and reacting to market swings — to become genuinely manageable. Without reliable data, accessible and interpreted in real time, decisions remain approximate, even for the most experienced leaders.
That is precisely the problem Agrolytics was designed to solve: connecting the existing data in your ERP, structuring it around your business's key indicators, and giving you actionable summaries without having to cross-reference files by hand.
Want to see what your data already says about your business? Book a demo — in 30 minutes, we show you concretely what your management can become.
Ready to take control of your data?
Book a 30-minute demo and see what Agrolytics can do for you.
Book a demo