Monday morning, 7:51
Laurent has run a charcuterie SME for eleven years. Nine million euros in revenue, twenty-six employees, eighty-five references sold to around forty customers. Like every Monday, he opens his emails over coffee.
A message is waiting — sent at 5:48, without anyone having written it. It contains three pieces of information he did not have.
First: the pork price on the Plérin market has risen 3.8% over the past two weeks. Six of his references mechanically fall below his margin threshold if purchase prices follow the trend.
Second: two distributor customers have not placed an order for nineteen days, against a usual cycle of ten to twelve days. A follow-up task has been created in his CRM and assigned to the rep who owns each account.
Third: a supplier invoice received on Friday is 7% above the budgeted price for that line. The gap has been notified to the purchasing manager.
Laurent asked for none of this. He exported no file, cross-referenced no spreadsheet, queried no tool. This scenario is only possible because the agent is connected to more than a single data source. That is where the real difference lies between an analysis tool and an agent that actually runs things.
Why a single source is not enough
An agent connected only to your ERP is already useful. It can monitor orders, detect volume drops, calculate margins by reference. That is real value.
But it is blind to everything happening outside your own operation. It does not know the pork price moved on the markets this week. It does not know your rep noted a difficult conversation with a key customer in the CRM. It does not know your team discussed a commercial opportunity worth seizing last week.
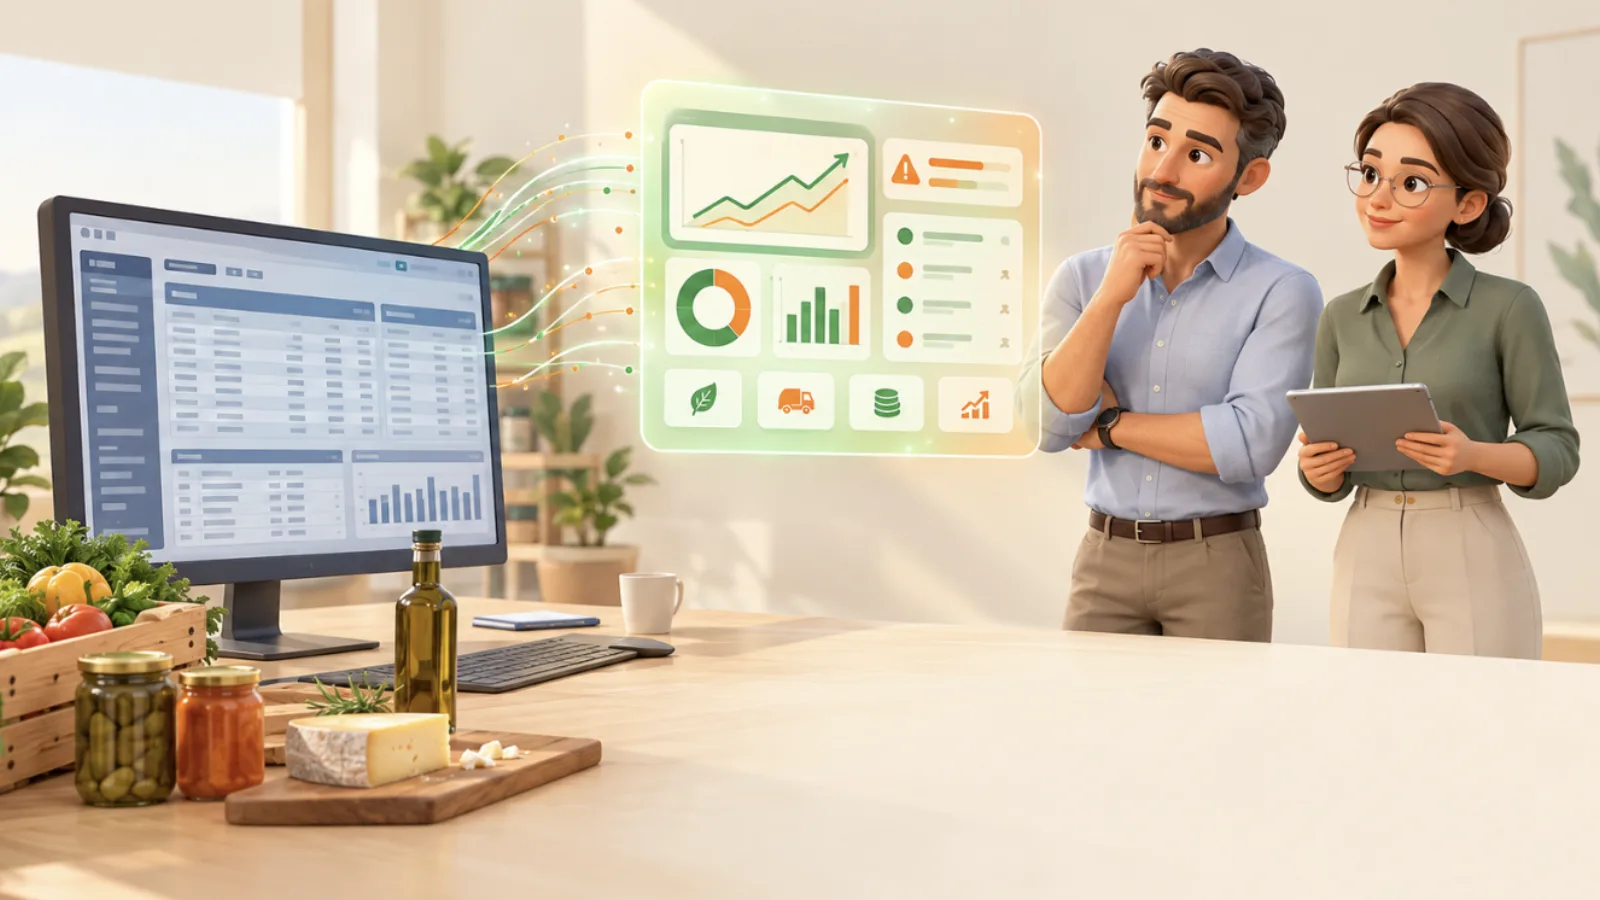
An agent that cross-references three layers of data sees a more complete reality — and can trigger more relevant actions. Those three layers are your company's internal data, your market's data, and your teams' everyday tools.
Layer 1 — Your company's internal data
This is the most obvious source, and often the first agents are connected to. It covers everything describing your company's activity: orders, purchasing, stock, cost prices, invoicing, payroll.
In the vast majority of food industry SMEs, this data lives in two or three main tools.
| Category | Common tools |
|---|---|
| ERP / Management | Sage 100, Cegid, SAP Business One, Microsoft Dynamics 365, Odoo |
| Accounting | Pennylane, QuickBooks, Xero, Sage Accounting |
| HR and payroll | Silae, Payfit, Lucca, ADP |
An agent connected to these sources can calculate contribution margin by reference in real time, detect a gap between actual and budgeted purchase prices, or monitor the drift of labour costs by production line. These analyses already exist in your tools — they simply are not produced automatically.
Layer 2 — Your market's data
This is the layer most management tools do not touch. Yet for a food industry SME whose production costs depend on volatile raw materials, what happens on the markets has a direct and immediate impact on profitability.
An agent able to query external sources can continuously monitor:
- Raw material prices: Euronext quotations on wheat, maize and rapeseed; pork indices on the Plérin market via UNIPORC; milk and dairy prices via FranceAgriMer
- Published sector data: price indices, production volumes and trends by segment published by ANIA, Agreste and FranceAgriMer
- Production cost indices: data useful for anticipating commercial negotiations with retailers or customers on price-revisable contracts
Concretely: when the pork price rises 4% over two weeks, the agent does not simply record it. It immediately cross-references it with layer 1 data — the cost price of every reference in your range — and calculates the impact product by product. Within minutes you know which ones fall below your target margin threshold, without opening a single file.
Key takeaway
market data is only valuable when cross-referenced with your own activity. On its own, the pork price is information. Cross-referenced with your cost prices and sales volumes, it is a signal to act.
Layer 3 — Your teams' everyday tools
This is often where the most operational — and least exploited — information sits. Your teams spend their days in tools your ERP does not see: email, CRM, calendars, shared documents. An agent connected to these tools can read signals that management data alone does not emit — and trigger actions directly where the work happens.
| Category | Compatible tools | What the agent can do there |
|---|---|---|
| CRM | Salesforce, HubSpot, Pipedrive, Sellsy, Zoho CRM | Detect customers with no recent activity, create follow-up tasks, update records |
| Gmail, Outlook (Microsoft 365) | Send targeted alerts, generate weekly summaries, detect incoming requests | |
| Collaboration | Slack, Microsoft Teams, Notion, Google Drive | Circulate reports to the team, create automatic notes, share alerts with the right recipient |
| Calendar | Google Calendar, Microsoft Calendar | Detect absences affecting production capacity, anticipate commercial deadlines |
Combining layers 2 and 3 is particularly powerful. When a raw material price crosses a critical threshold, the agent does not just alert the manager by email — it can create a task in the CRM to start a price review with the customers concerned, and post a message in the sales team's Slack channel. The chain of action triggers with no manual intervention.
What cross-referencing the three layers makes possible
Let us go back to Laurent and what actually happened overnight.
The agent queried the quotation indices and detected a 3.8% rise in the pork price over two weeks (layer 2). It cross-referenced that variation with the cost prices stored in Sage (layer 1) and identified the six references whose contribution margin would fall below the target threshold if purchase prices follow. It sent that analysis to Laurent by email and created a summary document in Notion for the purchasing team (layer 3).
In parallel, it analysed order cycles in the CRM (layers 1 and 3), detected two customers whose time since the last order exceeds their usual cycle by 60%, created two follow-up tasks in HubSpot assigned to the relevant reps, and included a summary in the morning email (layer 3).
These two analyses have nothing to do with one another. The first is a purchasing problem. The second is a commercial problem. Both deserved Laurent's attention that Monday — and neither would have been surfaced automatically by a tool that sees only one of those three layers.
Key takeaway
an agent that sees more sees differently. It is not the sophistication of the algorithm that creates the value — it is the breadth of what it is connected to.
What it changes in day-to-day decisions
Anticipating instead of absorbing. Most SMEs discover the impact of a raw material rise in their monthly accounts, sometimes six weeks after the fact. An agent monitoring the markets in real time makes it possible to start a price review before the margin is already gone.
Shortening commercial reaction times. A customer who has not ordered in three weeks is not necessarily lost — but you have to act now, not in ten days. An agent monitoring purchase cycles and creating follow-ups automatically shortens that delay without taking up the manager's attention.
Circulating information without friction. In many SMEs, information that should be shared is not, because nobody had time to consolidate it. An agent connected to collaboration tools automatically circulates the relevant summaries to whoever needs to read them — with no extra coordination meeting.
Going further
An agent's connection perimeter determines what it can see — and therefore what it can do. An agent limited to the ERP remains an internal analysis tool. An agent connected to the markets, to email, to the CRM and to collaboration tools becomes a full participant in day-to-day management.
That is the logic Agrolytics was built on. The platform offers two specialised agents: Marc, dedicated to commercial monitoring, watches your customers, your volumes and your sales channels; Sophie, dedicated to financial analysis, watches your margins, your costs and your profitability indicators. Together they cover the two most critical dimensions for a food industry SME leader — and they do so by cross-referencing your internal data, market data, and your everyday tools.
Want to see how Marc and Sophie fit concretely into your commercial and financial management? Book an Agrolytics demo — in 30 minutes, we show you what they can detect in your data.
Ready to take control of your data?
Book a 30-minute demo and see what Agrolytics can do for you.
Book a demo